How it holds
Same wall. Different sensory brief.
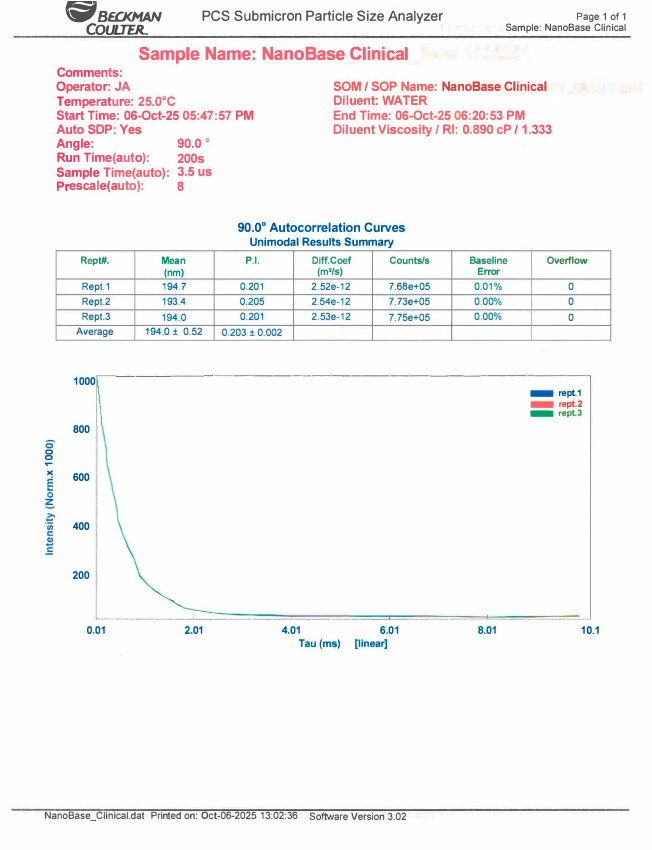
Clinical is not a separate chemistry. It is the Luxe electrostatic platform, the same anionic interfacial wall and the same three domains, tuned to give the finished treatment product a slower, more cushioned break and a more substantive skin feel. The delivery architecture underneath is unchanged, which is the point: you get the professional texture without trading away the colloid.
NE
Nanoemulsion domain
Lipid capacity at Luxe scale. Takes the oil phase you add downstream.
NL
Nanoliposomal domain
Bilayer organisation for peptides and sensitive hydrophilic actives. Intact and confirmed by distribution shape, not just by size.
NM
Nanomicellar reserve
Sized for treatment-grade oil loads. The compatibility buffer for what you build on top.
What Clinical is for
✕A rich treatment cream that gets its body from wax and thickener
→
✓Richness from a structured colloid, not from occlusive filler
✕Professional feel bought by sacrificing active delivery
→
✓Core delivery colloid measured Luxe-equivalent at the bench
✕A separate chemistry to qualify, validate and scale
→
✓Same wall, same QC gates as the rest of the platform
✕Heat and high shear to build the finished treatment product
→
✓Cold-processable downstream, like every NanoBase™ architecture
Clinical is the right choice when the brief calls for a substantive, professional-feeling treatment texture and you are not willing to give up the delivery architecture to get it. Like every NanoBase™ architecture, it is fully modular — any contract manufacturer can build the finished product on it.